Dashboards
The content pack ships an importable native dashboard covering the indicator set and the feed’s health.
Import the dashboard
Section titled “Import the dashboard”- Download
ellio_threat_intelligence.json. - In Google SecOps, go to Dashboards → Add → Import Dashboard and select the file.
- Set the dashboard time range to at least one push cycle (24 to 48 hours).
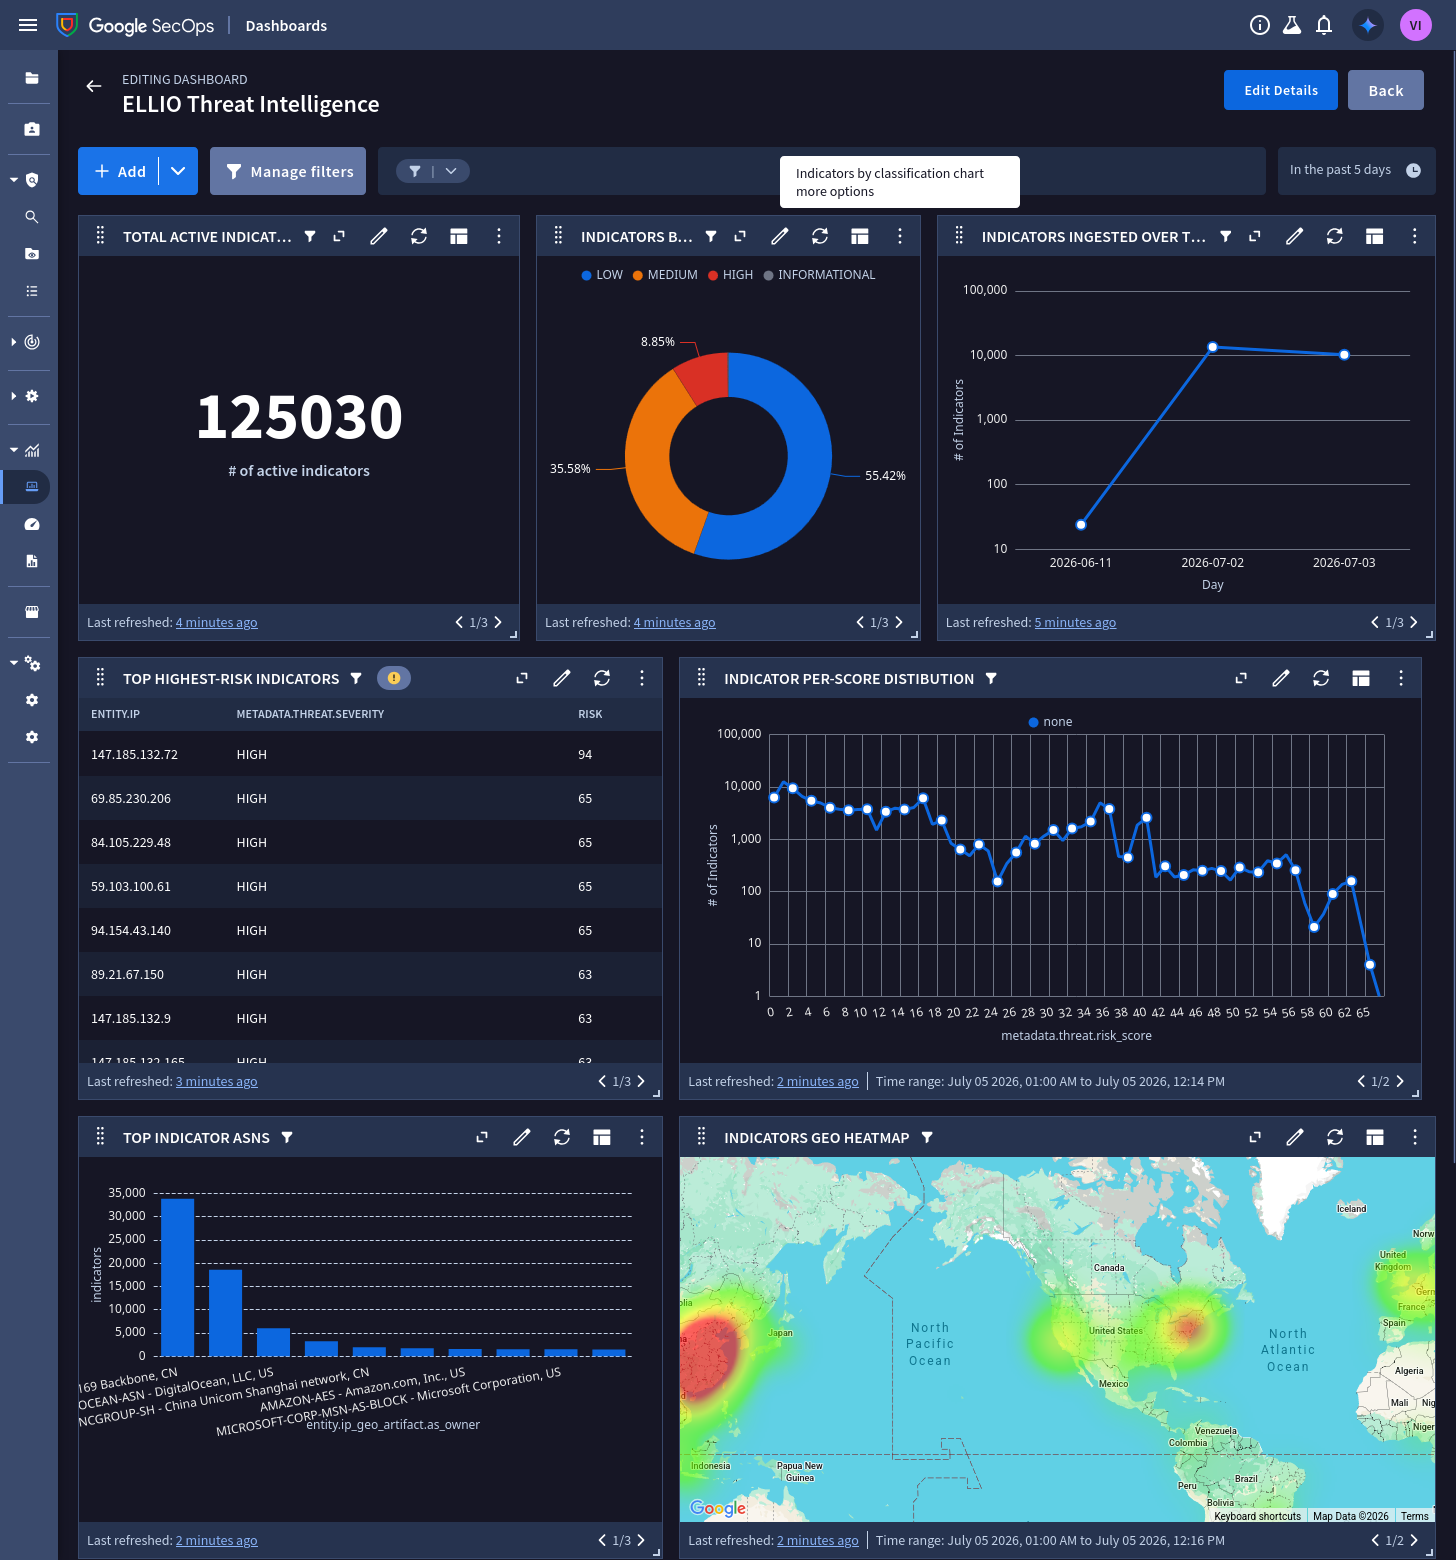
What it shows
Section titled “What it shows”| Widget | Type | Reads |
|---|---|---|
| Total active indicators | Value | entity graph, non-expired only |
| Indicators by classification | Donut | severity, one to one with classification |
| Top highest-risk indicators | Table (20) | entity graph |
| Indicator risk-score distribution | Line | entity graph |
| Indicators ingested over time | Line | entity graph |
| Top Indicator ASNs | Bar (10) | entity graph |
| Indicators geo heatmap | Map | entity graph |
| Ingestion - Events by Status | Table | ingestion metrics for the ELLIO log type |
| Ingestion Error Count | Value | ingestion metrics for the ELLIO log type |
The two ingestion widgets are your feed-health check: parsing or validation errors show up here first.
Building your own widgets
Section titled “Building your own widgets”Every entity-graph widget follows the same pattern - filter by product name, count distinct indicators:
graph.metadata.product_name = "ELLIO: Threat Intelligence"graph.metadata.entity_type = "IP_ADDRESS"graph.metadata.interval.end_time.seconds >= timestamp.current_seconds()outcome: $active_indicators = count_distinct(graph.entity.ip)Useful variations not in the export:
Leases expiring by day (how much of the set ages out when):
graph.metadata.product_name = "ELLIO: Threat Intelligence"$expiry_day = timestamp.get_timestamp(graph.metadata.interval.end_time.seconds, "%Y-%m-%d", "UTC")match: $expiry_dayoutcome: $expiring = count_distinct(graph.entity.ip)order: $expiry_day ascTop source countries:
graph.metadata.product_name = "ELLIO: Threat Intelligence"match: graph.entity.ip_geo_artifact.location.country_or_regionoutcome: $indicators = count_distinct(graph.entity.ip)order: $indicators descRisk score in 10-wide bands:
graph.metadata.product_name = "ELLIO: Threat Intelligence"$band = math.floor(graph.metadata.threat.risk_score / 10) * 10match: $bandoutcome: $count = count_distinct(graph.entity.ip)order: $band asc